Mining and metallurgical complex
Investment proposalsMetallurgy forms the basis of the economy.
 14.1%
14.1%
share of gross domestic product of Kazakhstan accounted for mining industry and quarrying
 17.5%
17.5%
The country's exports come from the mining industry, which is about $10.5 billion.
 300thousands of people
The enterprises of mining and metallurgical complex employ more than
* data for 2023
 11place
Kazakhstan ranks globally by the copper production and the 11th place by reserves.
 6place
Kazakhstan ranks globally by the gold production and the 13th place by reserves.
 1place
Kazakhstan ranks globally by uranium reserves and takes 1 place for its processing
 2place
Kazakhstan ranks globally by chromium
reserves with a share of 16.2% of world
reservation and ranks 2rd on its processing.
 11place
Kazakhstan ranks globally by the zinc production and the 6th place by reserves.
 1place
Kazakhstan ranks in the world in terms of tungsten reserves, total reserves are estimated at more than 2 million tons of tungsten trioxide
Kazakhstan also has deposits of rare earth metals such as lithium, vanadium, beryllium and others.
Reserves and production
Chrome

2/3
Uranium

2/1
Manganese

4/8
Lead

5/11
Zinc
5/8
Gold

15/21
Iron

11/13
Aluminium

10/8
Reserves and Output
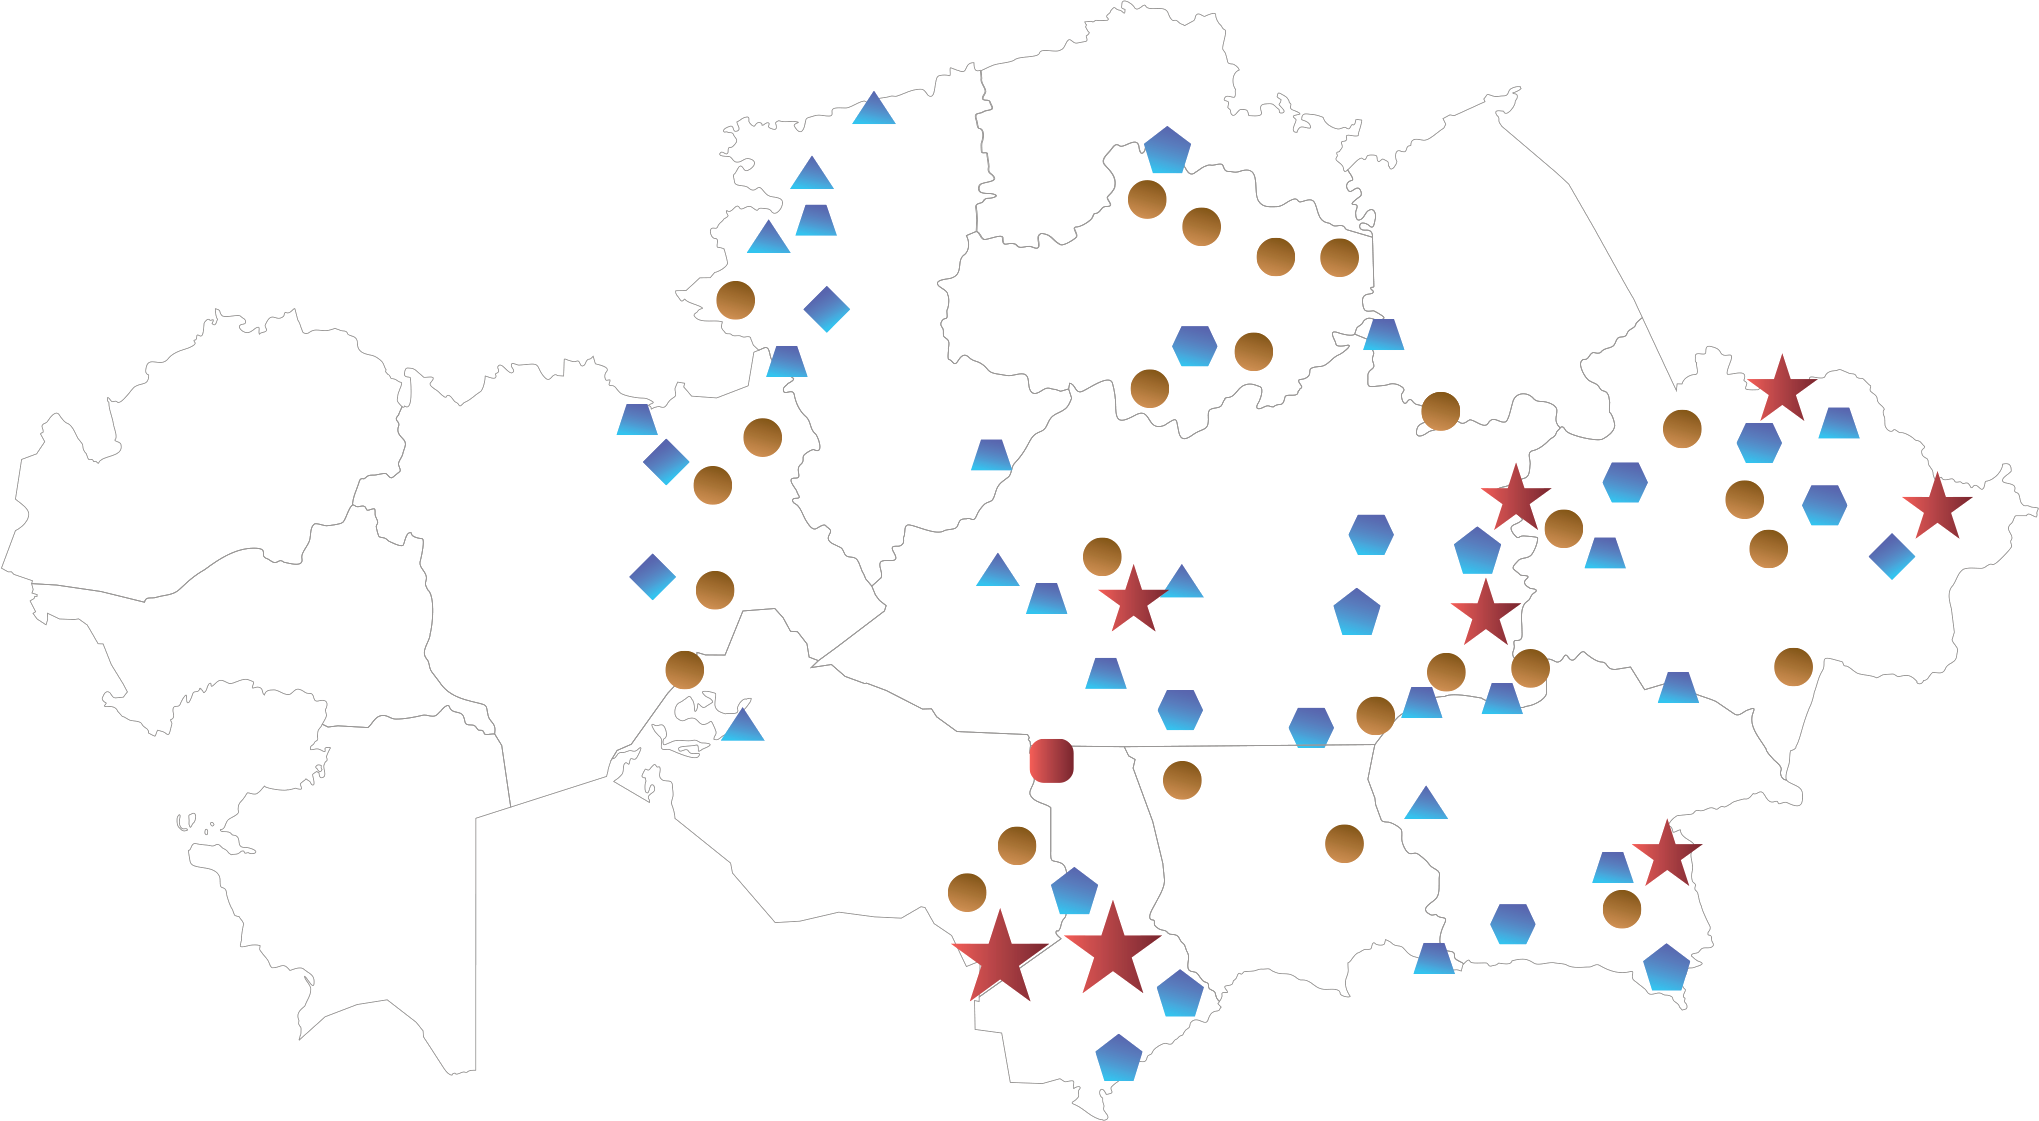

Polymetallic ore
| World rating, reserves | World rating, reserves | Share in the world volume | |
|---|---|---|---|
| Tungsten | 1 | - | - |
| Chrome ore | 2 | 3 | 16,2% |
| Manganese ore | 4 | 8 | 2,7% |
| Silver | 4 | 10 | 3,6% |
| Lead | 5 | 11 | 0,7% |
| Zinc | 5 | 8 | 2,5% |
| Bauxite (Aluminium) | 10 | 8 | 1,7% |
| Titan | 10 | 19 | 0,4% |
| Tin | 10 | - | - |
| Iron ore | 11 | 13 | 1% |
| Copper | 12 | 11 | 2,6% |
| Gold | 15 | 21 | 1,7% |
The volume of production of the metallurgical industry in the context of regions in January-December 2021, billion tenge
The concentration of industry in three regions:

Production
of main industry
types
of main industry
types
19%
East Kazakhstan
region
37.5%
Karaganda region
14.9%
Pavlodar region
Source: QazIndustry
Production of industrial products in the MMC in physical terms in the Republic of Kazakhstan for 2021
| Ores copper, thousand tons | 124 809.2 |
| Copper refined unwrought, unalloyed, thousand tons | 480.8 |
| Aluminum ores (bauxite), thousand tons | 121 905 |
| Aluminum raw; aluminium oxide, thousand tons | 1 662 |
| Ores lead-zinc, thousand tons | 6 678 |
| Unwrought refined lead, thousand tons | 130.9 |
| Zinc raw, thousand tons | 138.8 |
| Iron ore, thousand tons | 38 699.5 |
| Manganese ores, thousand tons | 1189.9 |
| Chrome ores, thousand tons | 6193.2 |
| Chrome concentrates, thousand tons | 3989.2 |
| Gold-bearing ores, thousand tons | 24 727 |
| Gold, worked or semi-worked, tons | 118.1 |
| Gold in Doré, tons | 35 |
| Ferroalloys, thousand tons | 2 000 |
Export-import
Note: DCP – domestic commodity producers

Source: QazIndustry
Investments in fixed assets
At the end of 2019, the volume of investments in fixed assets in the MMC amounted to 1,060 billion tenge.
Investments in fixed assets
(excluding coal mining), mln tenge
(excluding coal mining), mln tenge

Source: AMME


